How to Use Diagnostics & Create a Support Package
The Support section of ADReports lets you load and inspect application and service log files, search and filter log entries by date, severity, and keyword, and create a compressed support package that you can send to technical support.
Opening the Diagnostics Screen
- Launch ADReports.
- In the left-hand navigation bar, locate and click Support.
- The Diagnostics screen loads automatically inside the main panel.
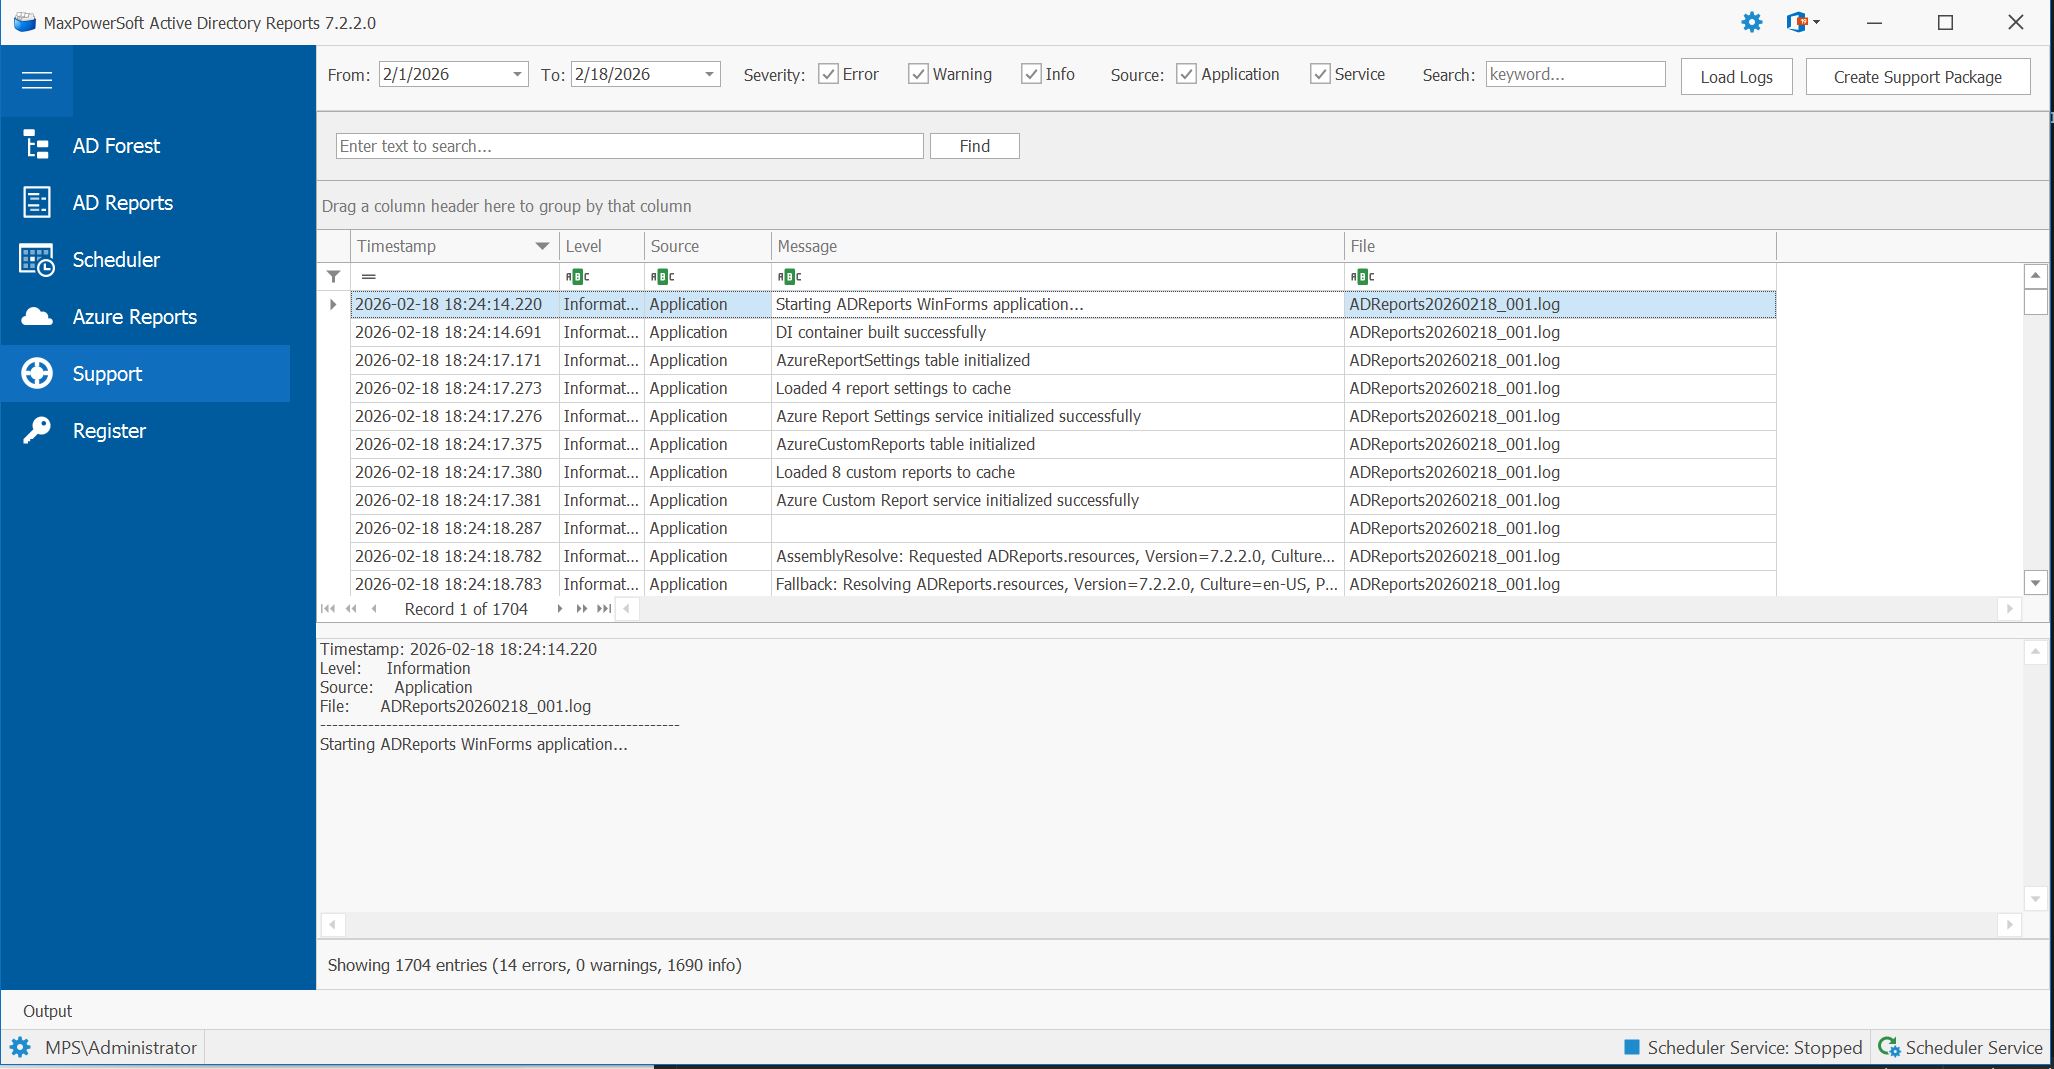
Understanding the Screen Layout
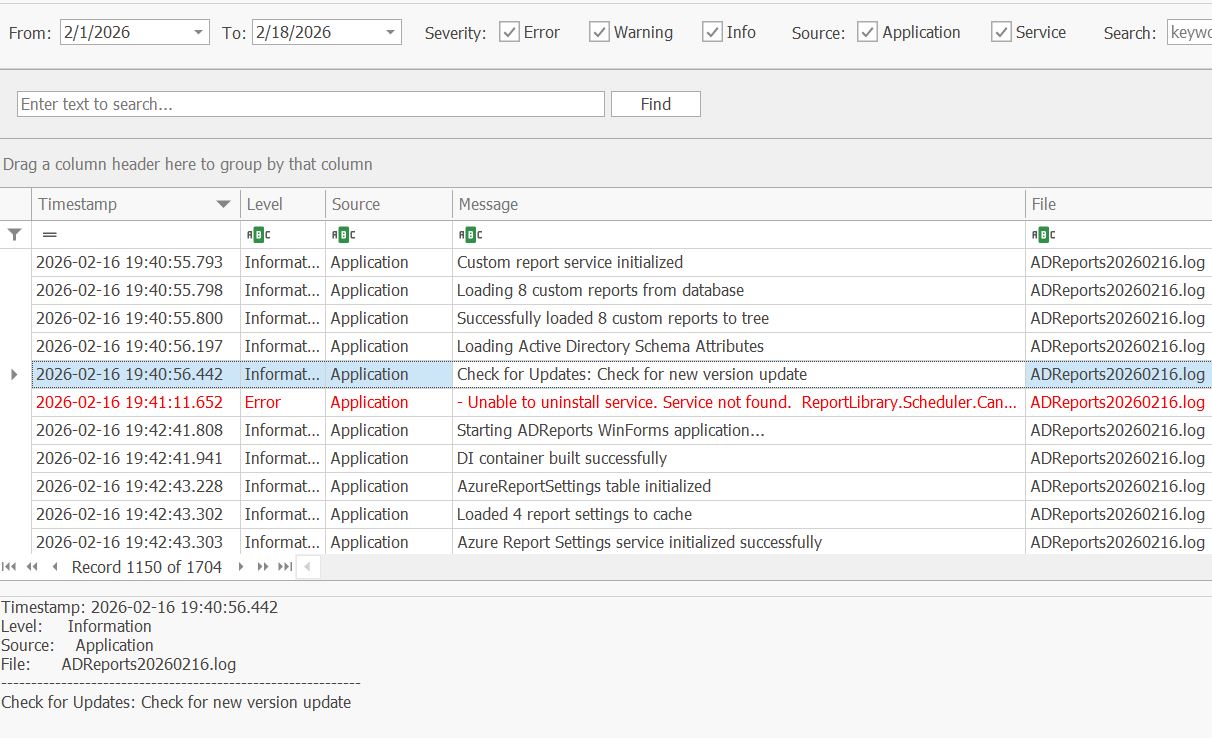
The Diagnostics screen is divided into four areas:
| Area | Description |
|---|---|
| Filter bar (top) | Controls for date range, severity, source, keyword, and action buttons. |
| Log Entries grid (middle) | Tabular list of all loaded log entries, sortable and searchable. |
| Entry Details panel (bottom) | Full text of the currently selected log entry, including stack traces. |
| Status bar (very bottom) | Shows the current state — Ready, loading progress messages, or a result summary. |
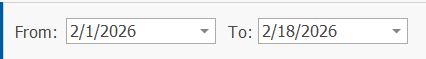
Setting the Date Range
The From and To date pickers at the left of the filter bar control which log files are read.
- Click the From date field and select the start date from the calendar popup.
- Click the To date field and select the end date.
Both fields default to today's date when you first open the screen. You can also type a date directly into either field.
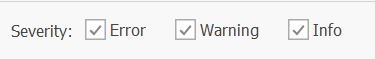
Choosing Severity Levels
Three severity checkboxes appear in the Severity group:
| Checkbox | Includes |
|---|---|
| Error | Error and Fatal entries |
| Warning | Warning entries |
| Info | Informational entries |
All three are checked by default. Uncheck one or more to narrow the results — for example, uncheck Info and Warning to see only errors.
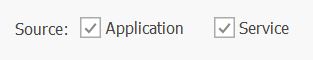
Choosing Log Sources
The Source group has two checkboxes:
| Checkbox | Log files read |
|---|---|
| Application | Logs produced by the ADReports desktop application. |
| Service | Logs produced by the ADReports background scheduler service. |
Both are checked by default. You must leave at least one source checked — if you uncheck both, the load will not start.
Searching by Keyword
The Search field (labelled keyword...) filters entries by text content.
- Click the Search field to the right of the Source checkboxes.
- Type a keyword, error code, username, or any text fragment.
- Only entries whose message text contains the keyword will be loaded.
Leave the field blank to load all entries matching the other filters. The search is case-insensitive.
Loading Log Entries
Once your filters are set:
- Click the Load Logs button at the right of the filter bar.
- The status bar at the bottom of the screen shows progress as each log file is read.
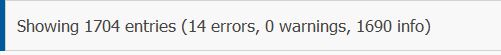
- When loading is complete, the status bar displays a summary such as:
Showing 342 entries (15 errors, 27 warnings, 300 info)
Reading the Log Grid
Loaded entries appear in the grid with the following columns:
| Column | Description |
|---|---|
| Timestamp | Date and time of the entry (yyyy-MM-dd HH:mm:ss.fff). Sorted newest-first by default. |
| Level | Severity: Information, Warning, Error, or Fatal. |
| Source | Which component wrote the entry: Application or Service. |
| Message | First line of the log message. |
| File | Name of the originating log file (e.g., ADReports20250207.log). |
Color coding: Error and Fatal entries appear in red, Warning entries in dark orange, and Informational entries in normal text.
Click any column header to sort by that column. Use the auto-filter row (the blank row directly below the column headers) to type a quick filter on any column without reloading. Use the Find panel to search across all columns simultaneously, and the navigator bar at the bottom of the grid to page through results.
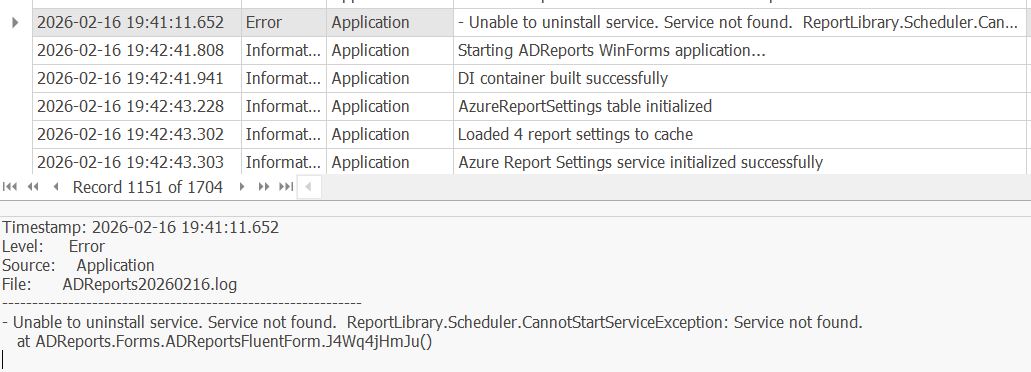
Viewing Entry Details
Clicking any row in the grid displays the full entry text in the Entry Details panel below the grid. This panel shows the full-precision timestamp, severity level, source, originating log file name, and the complete log message — including multi-line stack traces and exception details.
Cancelling a Load in Progress
If loading is taking a long time (e.g., a very wide date range):
- Click the Cancel button that replaces the Load Logs button during loading.
- The status bar shows Cancelling... briefly, then displays a partial-results summary:
Showing 120 entries (3 errors, 8 warnings, 109 info) — partial results (loading was cancelled) - The entries loaded so far remain in the grid and can still be used to create a support package.
Creating a Support Package
A Support Package is a ZIP archive that bundles the filtered log data with system information. You can send this file to technical support for faster diagnosis.
- Load the logs using your desired filter settings (see steps 3–7 above).
- Click the Create Support Package button at the far right of the filter bar.
- A confirmation dialog appears showing a summary of the package contents: time range covered, total number of entries, sources included, any active keyword search, and estimated file size.
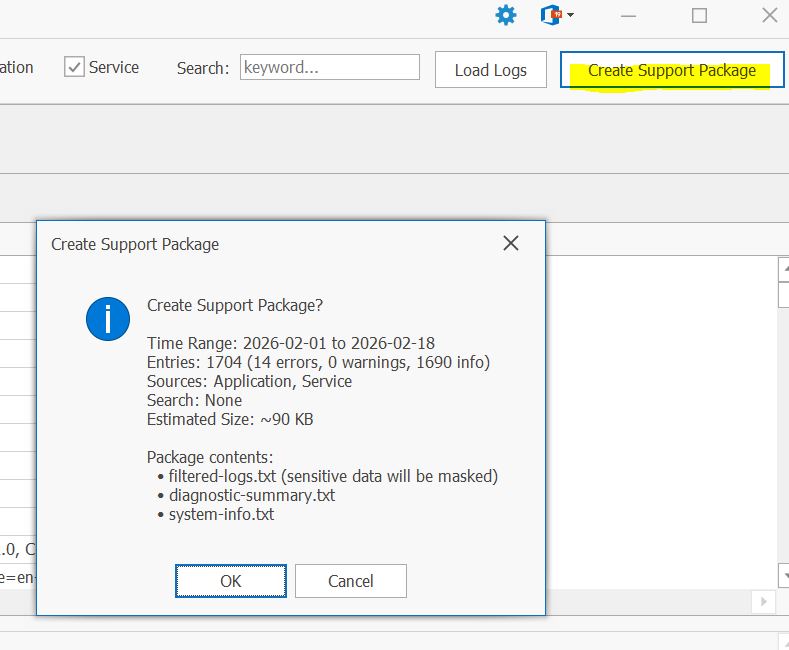
- Click OK to proceed, or Cancel to go back.
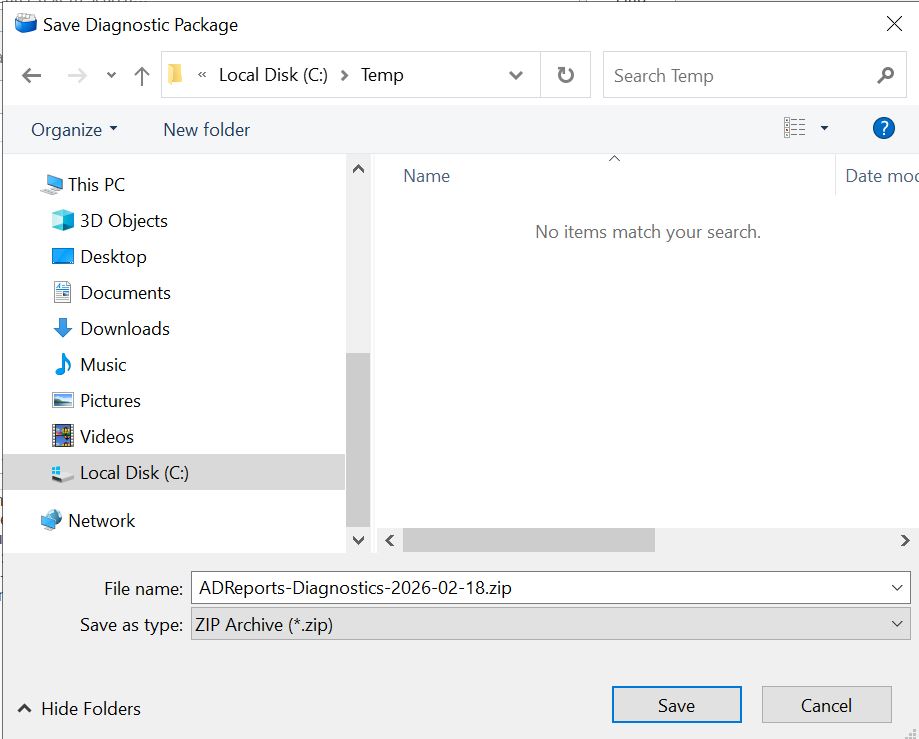
- A Save As dialog opens. Choose a folder and filename for the ZIP archive. The default filename is
ADReports-Diagnostics-YYYY-MM-DD.zipand the default location is your Documents folder. - Click Save. ADReports creates the archive — this is usually instantaneous.
- A success message appears asking whether you would like to open the folder containing the ZIP file. Click Yes to open File Explorer with the file selected, or No to stay in ADReports.
- Send the ZIP file to info@maxpowersoft.com so the support team can diagnose your issue.
What the package contains:
| File | Contents |
|---|---|
filtered-logs.txt |
All displayed log entries. Sensitive data (passwords, tokens, etc.) is automatically masked before inclusion. |
diagnostic-summary.txt |
Statistics and filter criteria used to produce the log set. |
system-info.txt |
OS version, .NET version, machine name, and other environment details useful for support. |
Tips & Troubleshooting
| Situation | What to do |
|---|---|
| No entries found | Widen the date range, or ensure at least one severity and one source are checked. |
| "From date cannot be after To date" error | Correct the date fields so that From is earlier than or equal to To. |
| "Please select at least one log source" error | Check at least one of the Application or Service checkboxes. |
| Load is very slow | Narrow the date range to a shorter period, or cancel and refine your filters. |
| Create Support Package button is greyed out | You must successfully load at least one log entry before the button becomes active. |
| Entry details are empty | Click a row in the grid to select it; the details panel updates automatically. |
| I need logs from multiple date ranges | Load and export one range first, then change the dates and create a second package. |