How to Use the Dashboard
The Dashboard provides a real-time overview of your Active Directory environment. Monitor key metrics, password health, domain controller status, privileged accounts, security alerts, and Azure Entra ID sync — all from a single screen.
Dashboard Overview
When you open the Dashboard, all widgets load in parallel and display live data from your Active Directory domain. The Dashboard is organized into several areas:
- Toolbar — domain selector, filters, refresh controls, and export
- KPI Tiles — eight key metrics across the top row
- Detail Widgets — password health (Default Policy & FGPP), domain controller health, privileged accounts, security alerts, account lockout trend, domain summary, recent group changes, recent GPO changes, and Azure Entra ID widgets

Toolbar & Filters
The toolbar at the top of the Dashboard lets you control the scope and refresh behavior for all widgets.
Filter Controls
- Domain — displays the currently selected domain name
- OU — filter all metrics by a specific Organizational Unit (default: All)
- Stale threshold — define how many days of inactivity mark an account as stale (options: 30, 60, 90, or 190 days; default: 90)
- Pwd expiring — define the window for passwords expiring soon (options: 7, 14, or 30 days; default: 14)
- Include disabled — include disabled accounts in KPI counts
- Include service accounts — include service accounts in KPI counts (enabled by default)
Refresh Controls
- Refresh All — manually refresh all widgets at once
- Auto-refresh — set a recurring refresh interval: Off, 5 min, 15 min, or 30 min
- Last refreshed — shows the timestamp of the most recent refresh
- Export — export the entire Dashboard to an Excel workbook with one sheet per widget

KPI Tiles
The top row displays eight key performance indicator (KPI) tiles, each showing a real-time count with a 7-day sparkline trend chart.
- Total Users — total number of user accounts in the domain
- Total Groups — total number of groups
- Computers — total number of computer objects
- Locked Out — currently locked out accounts
- Pwd Expiring — passwords expiring within the configured window (default: 14 days)
- Stale Accounts — accounts inactive beyond the configured threshold (default: 90 days)
- Disabled — disabled user accounts
- Critical Issues — computed count of security alerts, color-coded by severity
Each tile includes a sparkline chart showing the 7-day trend based on daily snapshots, along with a delta indicator comparing the current value against the previous day (green for improvements, red for concerns).
Click any KPI tile to navigate directly to the corresponding report with pre-applied filters. For example, clicking Locked Out opens the Locked Out Users report, and clicking Stale Accounts opens the Inactive Users report filtered to the configured stale threshold.
Each tile also has an individual Refresh button to update that specific metric without refreshing the entire Dashboard.

Password Health (Default Policy & FGPP)
The Dashboard displays two side-by-side Password Health widgets for a comprehensive view of password compliance:
- Password Health (Default Policy) — evaluates password expiration based on the Default Domain Policy maximum password age
- Password Health (FGPP) — evaluates password expiration based on each user's effective Fine-Grained Password Policy (FGPP)
Both widgets display a horizontal bar chart breaking down user accounts into the same five password categories:
- Compliant (green) — accounts with valid, non-expired passwords within policy
- Expiring Soon (orange) — passwords that will expire within the configured window
- Expired (red) — accounts with expired passwords
- Never Expires (blue) — accounts with the "Password Never Expires" flag set
- Must Change (red) — accounts requiring a password change at next logon
Each category shows the count and percentage. Comparing both widgets side by side helps you identify discrepancies between the Default Domain Policy and Fine-Grained Password Policies — for example, a user may appear compliant under the domain policy but have an expired password under their effective FGPP.

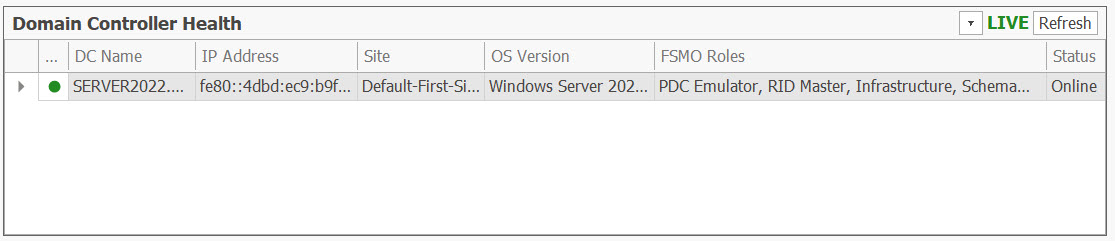
Domain Controller Health
The Domain Controller Health widget shows a table of all domain controllers in your domain with real-time status information:
- DC Name — the domain controller hostname
- IP Address — the DC's IP address
- Site — the Active Directory site the DC belongs to
- OS Version — the operating system running on the DC
- FSMO Roles — any FSMO roles held by the DC (PDC Emulator, RID Master, Infrastructure, Schema Master, Domain Naming Master)
- Status — current status: Online, Degraded, or Offline
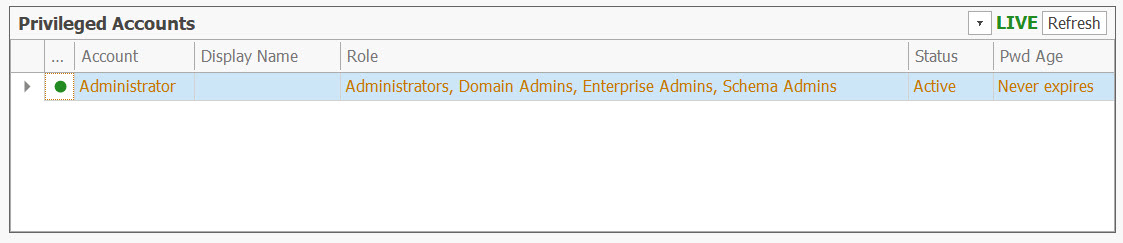
Privileged Accounts
The Privileged Accounts widget lists all user accounts that are members of administrative groups (such as Domain Admins, Enterprise Admins, Schema Admins, and Administrators). The table includes:
- Account — the SAM account name
- Display Name — the user's display name
- Role — the administrative groups the account belongs to
- Status — whether the account is Active, Locked, or Disabled
- Pwd Age — the number of days since the last password change
Accounts with stale passwords (older than 90 days) are highlighted in yellow, and disabled accounts are shown in red, making it easy to spot privileged accounts that need attention.
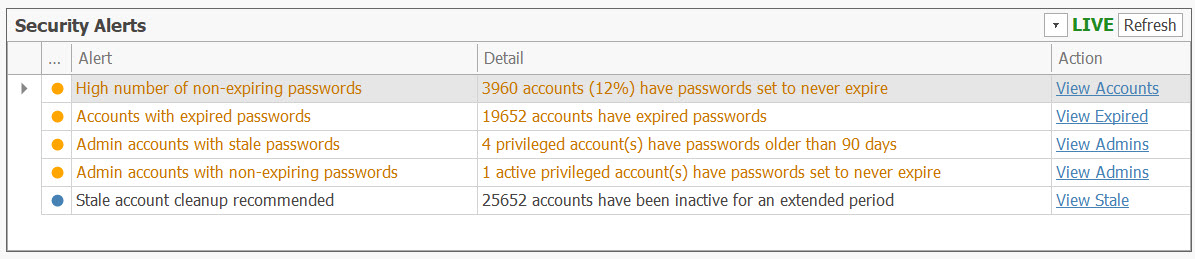
Security Alerts
The Security Alerts widget automatically evaluates data from the other widgets and generates actionable alerts. Alerts are categorized by severity:
- Critical — lockout spikes (more than 5 locked accounts) and offline domain controllers
- Warning — expired passwords, high percentage of non-expiring passwords (over 10%), admin accounts with stale or non-expiring passwords, and disabled accounts in admin groups
- Info — stale account cleanup recommendations (more than 100 stale accounts)
Each alert includes a description, detail count, and a clickable Action link that navigates directly to the relevant report for further investigation. For example, clicking View Expired opens the Password Expired report, and View Admins opens the All Administrators report.
The Critical Issues KPI tile in the top row reflects the total count from this widget, with its color changing based on the highest severity alert (green when all clear, amber for warnings, red for critical issues).
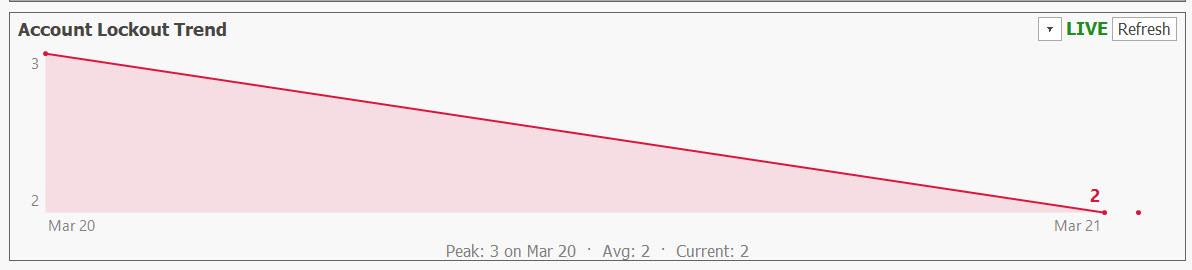
Account Lockout Trend
The Account Lockout Trend widget displays a 30-day line chart of daily lockout counts, based on snapshots stored in the local database. The chart shows:
- Peak — the highest lockout count and the date it occurred
- Average — the average daily lockout count over the period
- Current — today's lockout count
This helps you identify lockout patterns and detect potential brute-force attacks or misconfigured service accounts. Click anywhere on the chart to navigate to the Locked Out Users report.
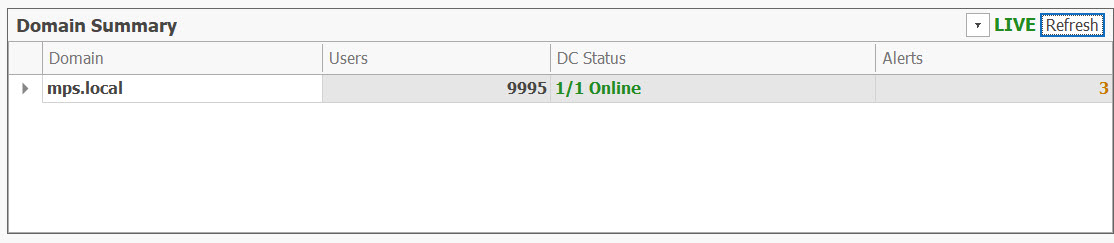
Domain Summary
The Domain Summary widget provides a multi-domain overview, showing key metrics for every domain configured in AD Reports:
- Domain — the domain name (current domain is shown in bold)
- Users — total user count for the domain
- DC Status — number of online domain controllers vs. total (e.g., "1/1 Online")
- Alerts — number of security alerts for the domain
Domains that are unreachable are shown grayed out with "N/A" values. Each domain is queried in parallel with a 15-second timeout to prevent any single domain from delaying the Dashboard.
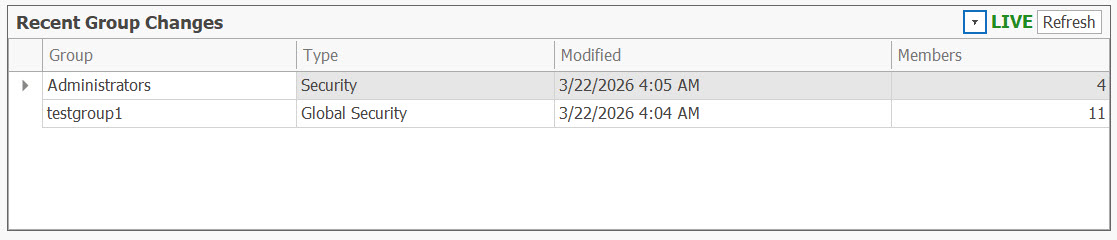
Recent Group Changes
The Recent Group Changes widget lists groups that have been modified in the last 7 days. The table shows:
- Group — the group name
- Type — the group type (Security or Distribution)
- Modified — the date the group was last modified
- Members — current member count
This widget helps you track membership changes and detect unexpected modifications to sensitive groups.
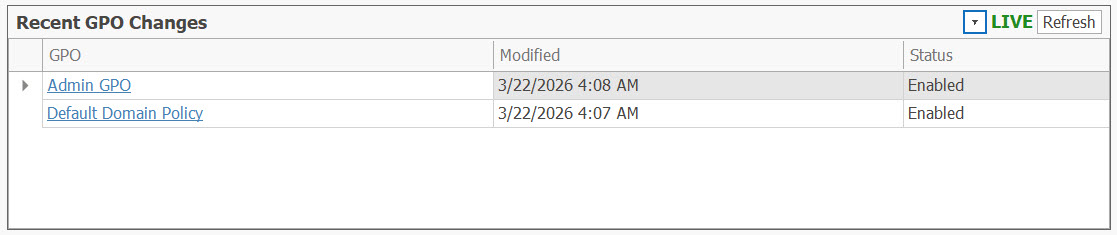
Recent GPO Changes
The Recent GPO Changes widget lists Group Policy Objects that have been modified in the last 7 days. The table shows:
- GPO — the Group Policy Object name
- Modified — the date the GPO was last modified
- Status — the current GPO status
Click on a GPO name to navigate to the GPO Changes report filtered to show changes from the last 7 days.
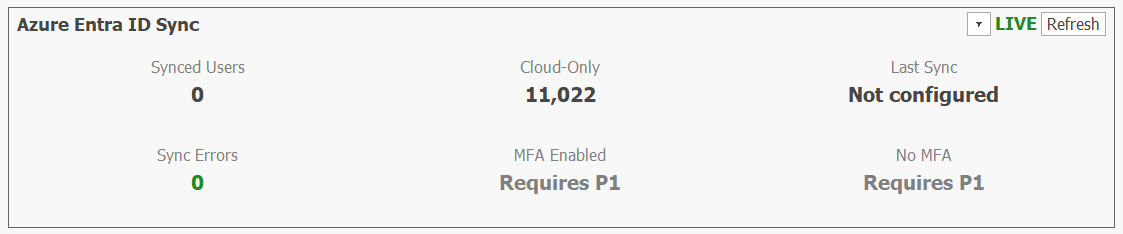
Azure Entra ID Sync
The Azure Entra ID Sync widget shows synchronization metrics between your on-premises Active Directory and Microsoft Entra ID (Azure AD):
- Synced Users — number of users synced from on-premises AD to Entra ID
- Cloud-Only — number of users that exist only in Entra ID
- Last Sync — timestamp of the most recent directory sync
- Sync Errors — number of synchronization errors
- MFA Enabled — number of users with multi-factor authentication enabled ( Shows live counts with Entra ID P1/P2)
- No MFA — number of users without MFA ( Shows live counts with Entra ID P1/P2)
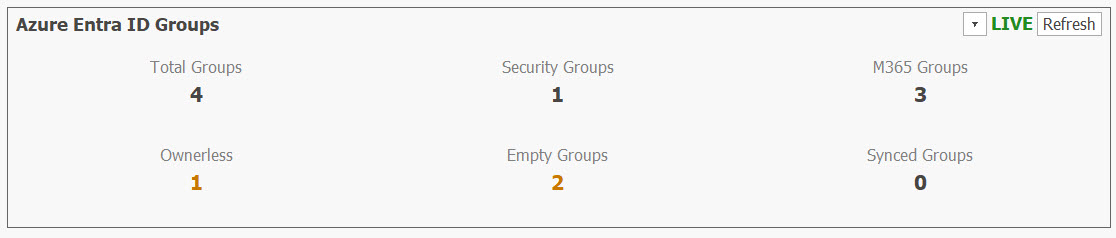
Azure Entra ID Groups
The Azure Entra ID Groups widget provides an overview of groups in your Microsoft Entra ID tenant:
- Total Groups — total number of groups in Entra ID
- Security Groups — number of security groups
- M365 Groups — number of Microsoft 365 groups
- Ownerless — groups with no assigned owner
- Empty Groups — groups with no members
- Synced Groups — groups synced from on-premises AD
This helps you identify cloud group hygiene issues such as ownerless or empty groups that may need cleanup.
Collapse & Expand Widgets
Each detail widget (below the KPI tiles) can be collapsed or expanded by clicking the arrow button in the widget header. Collapsed widgets show only their title bar, saving screen space. Your collapsed/expanded preferences are saved automatically and persist between sessions.
LIVE Indicator & Per-Widget Refresh
Each detail widget has a LIVE badge and a Refresh button in its header. The LIVE badge indicates that the widget displays real-time data from your Active Directory. Click the Refresh button on any widget to refresh just that widget's data without refreshing the entire Dashboard.
Export Dashboard to Excel
Click the Export button in the toolbar to export the entire Dashboard to an Excel workbook. The export creates a multi-sheet workbook containing:
- Summary — export metadata, domain name, timestamp, and current filter settings
- Password Health (Default Policy) — category breakdown with counts and percentages
- Password Health (FGPP) — FGPP-aware category breakdown with counts and percentages
- DC Health — domain controller table with status
- Privileged Accounts — all administrative accounts
- Security Alerts — all computed alerts with severity
- Domain Summary — multi-domain summary
- Recent Group Changes — group modifications from the last 7 days
- Account Lockout Trend — 30-day lockout snapshot history
- Recent GPO Changes — GPO modifications from the last 7 days
- Azure Sync — Entra ID sync metrics (if authenticated)
- Azure Groups — Entra ID group metrics (if authenticated)
Ready to Try AD Reports?
Download the free 14-day trial and start reporting on your Active Directory today.
Download Free Trial Browse Report Library